Home › Data Study
2026 DataPet insurance costs vary widely across the United States — by roughly 2–3x depending on where you live. This study breaks down the estimated average monthly premium for dogs and cats in all 50 states[1], so you can see how your state compares.
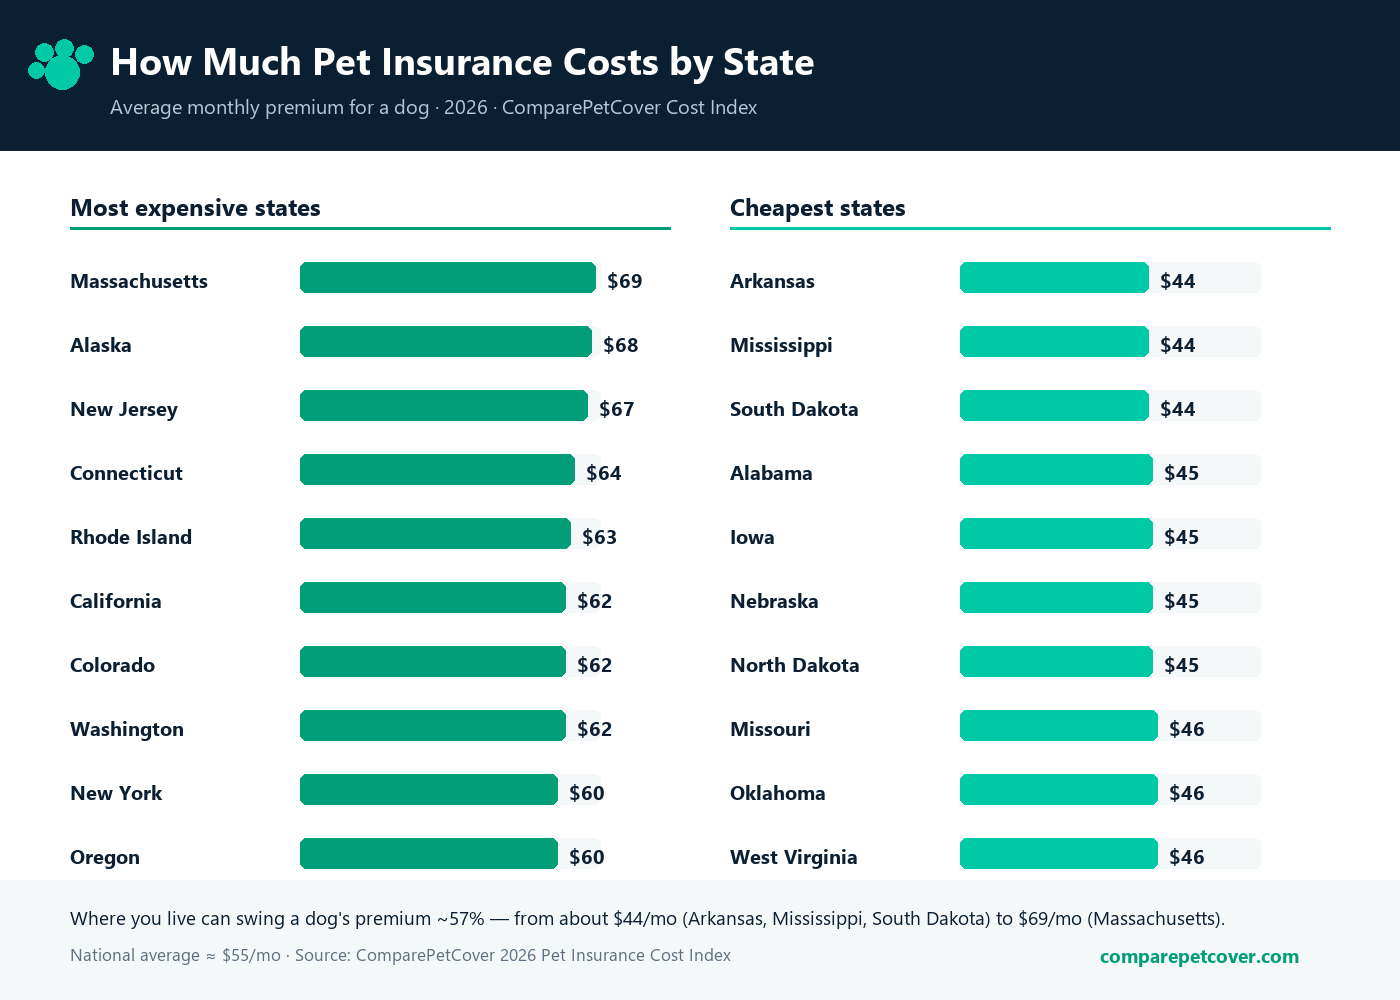
Paste this code as-is. It keeps the image linked back to this study, so your readers (and search engines) can trace the source.
- Nationally, accident-and-illness coverage averages $69.67/month for dogs and $36.25/month for cats, from NAPHIA's 2025 figures of $836 and $435 a year.
- Dog premiums rose 11.5% in a single year and 33.8% since 2021, when the US average was $625 a year. Cat premiums rose 12.6% last year.
- Geography alone separates the most expensive state (California, index 110.7) from the least expensive (Arkansas, index 86.9) by 26%, or about $192 a year ($924 vs $732). That is far less than most cost guides claim.
- 15 states sit in the high-cost tier, 7 near the national average, 29 below it.
- Average premiums rose faster than the published vet price index, and that is not the scandal it looks like. Dog premiums rose 33.8% between 2021 and 2025 (NAPHIA), 7.5% a year, against 4.5% a year for US veterinary prices (BLS). The two series measure different things, and we explain below why we do not treat the difference as a finding.
- Below state level the data runs out. The BEA splits 47 states into metropolitan and non-metropolitan price areas, but 20 of them carry identical values for both, so we publish no city or metro premiums. Treat any source that does with suspicion.
Most expensive states (dogs)
- California — $77/mo (dogs)
- Hawaii — $77/mo (dogs)
- New Jersey — $76/mo (dogs)
- New York — $75/mo (dogs)
- Washington — $75/mo (dogs)
- Massachusetts — $74/mo (dogs)
- Maryland — $73/mo (dogs)
- New Hampshire — $73/mo (dogs)
Most affordable states (dogs)
- Arkansas — $61/mo (dogs)
- Mississippi — $61/mo (dogs)
- Iowa — $61/mo (dogs)
- Oklahoma — $61/mo (dogs)
- Louisiana — $61/mo (dogs)
- South Dakota — $62/mo (dogs)
- Alabama — $62/mo (dogs)
- North Dakota — $62/mo (dogs)
Pet insurance in Iowa · Colorado pet insurance costs · Michigan pet insurance · Minnesota pet insurance · New Hampshire pet insurance · New Mexico pet insurance · Idaho pet insurance
Average pet insurance cost by state — full table
Modelled average monthly premium for accident-and-illness coverage. The underlying premium year is 2025, the most recent NAPHIA has published, and the price-parity year is 2024. National average: $69.67/mo (dogs), $36.25/mo (cats), from NAPHIA's 2025 US averages of $836 and $435 a year. The index is each state's BEA regional price parity (US=100). How we built this →
| State | Dogs (avg/mo) | Cats (avg/mo) | Cost Index (US=100) | vs. national |
|---|---|---|---|---|
| Alabama | $62 | $32 | 88.8 | Below avg |
| Alaska | $71 | $37 | 102.4 | Above avg |
| Arizona | $70 | $36 | 100.7 | Average |
| Arkansas | $61 | $32 | 86.9 | Below avg |
| California | $77 | $40 | 110.7 | Above avg |
| Colorado | $72 | $37 | 103.1 | Above avg |
| Connecticut | $72 | $38 | 103.6 | Above avg |
| Delaware | $70 | $36 | 99.8 | Average |
| District of Columbia | $77 | $40 | 109.9 | Above avg |
| Florida | $72 | $37 | 103.4 | Above avg |
| Georgia | $67 | $35 | 96.3 | Below avg |
| Hawaii | $77 | $40 | 110.0 | Above avg |
| Idaho | $67 | $35 | 95.5 | Below avg |
| Illinois | $70 | $36 | 100.0 | Average |
| Indiana | $65 | $34 | 93.3 | Below avg |
| Iowa | $61 | $32 | 87.8 | Below avg |
| Kansas | $63 | $33 | 90.1 | Below avg |
| Kentucky | $63 | $33 | 90.2 | Below avg |
| Louisiana | $61 | $32 | 88.2 | Below avg |
| Maine | $68 | $35 | 97.0 | Below avg |
| Maryland | $73 | $38 | 105.0 | Above avg |
| Massachusetts | $74 | $38 | 105.8 | Above avg |
| Michigan | $67 | $35 | 96.2 | Below avg |
| Minnesota | $69 | $36 | 98.6 | Average |
| Mississippi | $61 | $32 | 87.0 | Below avg |
| Missouri | $63 | $33 | 90.8 | Below avg |
| Montana | $66 | $34 | 94.6 | Below avg |
| Nebraska | $63 | $33 | 90.1 | Below avg |
| Nevada | $70 | $36 | 100.0 | Average |
| New Hampshire | $73 | $38 | 104.2 | Above avg |
| New Jersey | $76 | $39 | 108.8 | Above avg |
| New Mexico | $64 | $33 | 92.2 | Below avg |
| New York | $75 | $39 | 107.9 | Above avg |
| North Carolina | $66 | $34 | 94.3 | Below avg |
| North Dakota | $62 | $32 | 89.0 | Below avg |
| Ohio | $65 | $34 | 92.8 | Below avg |
| Oklahoma | $61 | $32 | 87.8 | Below avg |
| Oregon | $72 | $37 | 103.4 | Above avg |
| Pennsylvania | $68 | $35 | 97.6 | Below avg |
| Rhode Island | $71 | $37 | 102.3 | Above avg |
| South Carolina | $65 | $34 | 93.7 | Below avg |
| South Dakota | $62 | $32 | 88.6 | Below avg |
| Tennessee | $64 | $33 | 91.9 | Below avg |
| Texas | $68 | $35 | 97.1 | Below avg |
| Utah | $69 | $36 | 98.9 | Average |
| Vermont | $68 | $36 | 98.0 | Below avg |
| Virginia | $70 | $37 | 101.1 | Average |
| Washington | $75 | $39 | 107.0 | Above avg |
| West Virginia | $62 | $32 | 89.5 | Below avg |
| Wisconsin | $66 | $34 | 94.1 | Below avg |
| Wyoming | $65 | $34 | 92.7 | Below avg |
Why we publish no city-level prices
We do not publish city-level premiums, and it is worth saying why. No public dataset prices pet insurance below state level. The BEA publishes separate price parities for the metropolitan and non-metropolitan portion of each state, but 20 of the 47 states it splits carry identical values for both portions, which reflects how those estimates are built rather than any real equality of prices. Anyone quoting you a precise city figure is modelling it from thinner air than this. The metro guides below carry their state's modelled figure and focus on what genuinely differs locally: the risks, the referral hospitals, and who regulates your policy.
| Metro guide | Dogs / mo | Cats / mo | State figure |
|---|---|---|---|
| Chicago, IL | $70 | $36 | Illinois |
| Kansas City | $63 | $33 | Missouri |
| Louisville, KY | $63 | $33 | Kentucky |
| Des Moines, IA | $61 | $32 | Iowa |
| Boise, ID | $67 | $35 | Idaho |
Do premiums track the cost of care?
Every cost guide tells you pet insurance is getting more expensive. Almost none put a number next to it. Here are the two published series, and then the reason we will not draw the conclusion you might expect from them.
| 2021 to 2025 | Total | Per year | Source |
|---|---|---|---|
| Average dog premium (accident & illness) | +33.8% | 7.5% | NAPHIA, $625 to $836 a year |
| US veterinary service prices | +19.4% | 4.5% | BLS CPI, series CUUR0000SEMD01 the 2025 annual average is our own calculation from BLS data, not a BLS publication |
How we are paid: some insurer links on this site may pay us a fixed referral fee when a reader requests a quote, including links to insurers whose premiums feed the figures above. It does not change the numbers, which come from NAPHIA, the BEA and the BLS, but you should know it before you read our conclusions.
Why we do not call this a gap. The CPI follows the same services month after month. The average premium follows a population, and that population changed. The dogs adopted in 2020 and 2021 moved four years up the age bands every insurer rates on, and premiums rise steeply with age by design. More policies now carry high or unlimited annual limits than in 2021. Claim frequency rose. Each of those lifts the average premium without any single owner paying more for the same cover. Neither we nor anyone working from public data can say how much of the 7.5% survives once those are stripped out, so we do not present the difference as a finding about how insurers priced.
The question with a real answer is whether insurers kept a larger share of each dollar, measured as claims paid against premiums written. We cannot test that with what is published, and we will not draw a conclusion we cannot support. If NAPHIA or an individual insurer publishes those figures for these years, we will update this page.
What does not change either way is the reason to hold a policy. It is protection against one large, unpredictable bill. It was never a hedge that moves in step with a published price index, and it should not be bought as one.
Method, and a correction. Premiums are average annual accident-and-illness premiums for US dogs, all five years taken from a single edition, NAPHIA's State of the Industry Report 2026, page 22. NAPHIA revises earlier years between editions, so figures from different editions cannot be chained. This is total premium divided by insured pets, not the price of any given policy. Veterinary prices are BLS series CUUR0000SEMD01, US city average, not seasonally adjusted. The Bureau did not collect the October 2025 index during the lapse in appropriations, so our 2025 annual average substitutes the mean of September and November; one month carries a twelfth of an annual average, so even a full index point of error there moves the four-year change by about 0.02 points. Corrected 23 September 2026: an earlier version of this section concluded that premiums had not tracked the cost of care. The two series are not comparable in that way, and we have withdrawn that conclusion.
Why pet insurance costs differ by state
Three local factors drive most of the variation: local veterinary prices (highest in major metros and high-cost-of-living states), access to specialty and emergency hospitals (which raises the price of advanced care), and regional pet-health risks (tick-borne disease in the Northeast, heartworm and heat in the Southeast, rattlesnakes and Valley Fever in the desert Southwest, harsh winters in the north). Your individual quote also depends on your pet's breed, age, and ZIP code.
For journalists & researchers
Quotable summary: “Where you live moves the cost of insuring a dog far less than most cost guides claim: about 26%, from $61 a month in Arkansas to $77 in California, a gap of roughly $192 a year. The bigger story is time, not place. The US average dog premium rose 11.5% in a single year and 33.8% since 2021,” according to the 2026 Pet Insurance Cost Index by ComparePetCover, built from NAPHIA's 2025 industry data and BEA regional price parities.
We can provide state-level breakdowns, tier lists, or custom data cuts on request — email contact@comparepetcover.com. Attribution with a link to this page is all we ask.
Methodology
Every figure on this page comes from two public primary sources and one formula. Anyone can reproduce it.
National base. NAPHIA, State of the Industry Report 2026 (published 21 June 2026), page 22: the 2025 US average accident-and-illness premium was $836 a year for dogs and $435 for cats. NAPHIA's data is compiled by Willis Towers Watson, an independent third party, and is estimated to represent roughly 99% of written pet health insurance premium in the US and Canada combined; NAPHIA does not publish a US-only coverage figure.
Veterinary price trend. US Bureau of Labor Statistics, Consumer Price Index, Veterinarian services, US city average, not seasonally adjusted, series CUUR0000SEMD01.
Geographic adjustment. US Bureau of Economic Analysis, Regional Price Parities by state, All Items, 2024 (released 19 February 2026), where US=100.
The formula. monthly = (national annual × state RPP / 100) / 12. Worked example, Arizona: 836 × 1.00677 = $841.66 a year, or $70 a month.
Why there are no city figures. We built a metropolitan and non-metropolitan split from the BEA's PARPP table and then dropped it. Two reasons. It would have mixed statistics, since the state figures use All Items and the sub-state table we had used Services: Other. And 20 of the 47 states BEA splits carry identical values for both portions, which is an artefact of how those estimates are produced, not a finding about prices. Publishing a city number on that basis would have been precision we had not earned.
The biggest assumption, stated plainly. NAPHIA's $836 is the average of policies actually sold, and that book of business is not spread evenly across the country. Multiplying it by a state price parity assumes $836 corresponds to a place where the parity is exactly 100, which we cannot verify. It also assumes a premium moves one-for-one with the general price level, when only the claims portion of a premium is exposed to local vet pricing. Both assumptions push in the same direction for expensive states and we have not corrected for either. Premiums are also rising fast, 11.5% in the last published year, so a 2025 average read in 2026 is likely on the low side.
What this does not capture, stated plainly. The RPP measures general price levels, not veterinary pricing, because no public index of veterinary prices by state exists. Our model therefore isolates the geographic component alone, a spread of about 1.26× between the most and least expensive state. A real spread between two quotes is wider, because breed, age, deductible, reimbursement rate and insurer all matter more than geography. We do not model those, and we publish no ranges, because NAPHIA reports averages rather than quantiles. The premium year is 2025 and the price-parity year is 2024; both are the most recent published at the time of writing. These are modelled averages, not quotes.
- NAPHIA — State of the Industry Report (average pet-insurance premiums by market). naphia.org/industry-data (accessed September 2026).
- American Veterinary Medical Association (AVMA) — U.S. Pet Ownership Statistics (veterinary costs & cost of care). avma.org (accessed September 2026).
- National Association of Insurance Commissioners (NAIC) — Pet Insurance (regulation & consumer protections). content.naic.org (accessed September 2026).
Frequently Asked Questions
Why does pet insurance cost more in some states?
Premiums track local veterinary costs. States and metro areas with higher vet bills and cost of living — think California, New York, or Florida cities — run higher than rural, lower-cost states, because that is where insurers expect to pay more per claim.
Which states have the cheapest pet insurance?
Lower-cost, more rural states generally have the lowest premiums, while expensive urban areas sit at the top. It closely mirrors what a vet visit costs where you live.
Does my premium change if I move to another state?
Yes. Your rate is tied to your ZIP code, so at renewal it is recalculated for your new location — it can go up or down depending on local vet pricing. Your coverage itself stays the same.